Comparative Cost & Profitability Study
Released: Annually
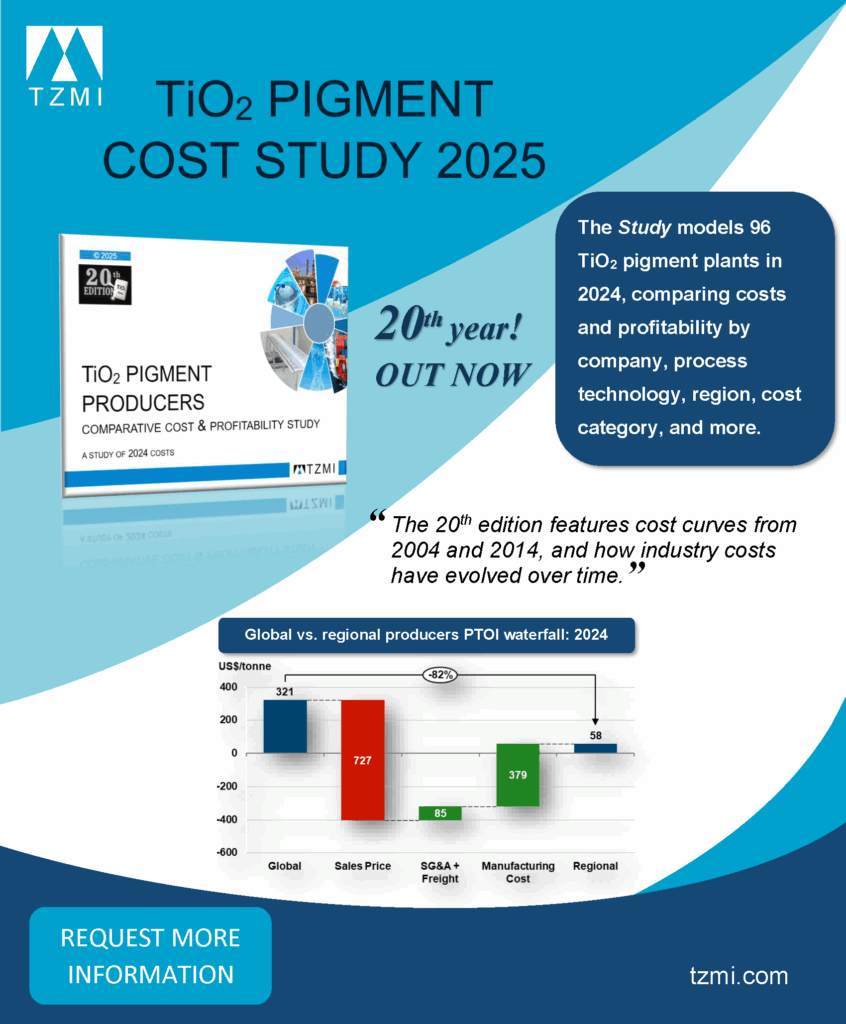
The TiO2 Pigment Producers Comparative Cost and Profitability Study (PCS) provides a detailed analysis of the TiO2 pigment manufacturing industry for the prior year.
The 2025 edition of the study covers 96 plants, representing more than 98% of global TiO₂ capacity in 2024:
- 71 sulfate technology plants
- 24 chloride technology plants
- 1 novel HCl technology plant
CONTENTS
EXECUTIVE SUMMARY
METHODOLOGY
TiO2 PIGMENT MARKET FUNDAMENTALS
- TiO2 pigment pricing fundamentals
- Methodology changes
- TiO2 pigment pricing long-term expectations
- TiO2 pigment price forecasts
- TiO2 pigment demand
- Operating rates
TiO2
COST AND PROFITABILITY CURVES
- TiO2 global cost curve: year in review
- Global revenue to cash cost curve: year in review
- TiO2 global profitability curve: year in review
- Cost and profitability: All plants – year in review
- Industry manufacturing cash costs: Five year review
- TiO2 global cost curve: year in review
- Global producers
- Regional producers
- TiO2 cost curve by producer type
- TiO2 pigment profitability curve by producer type
- Regional view of manufacturing costs
- TiO2 pigment cost curve by region
- TiO2 pigment profitability curve by region
- Regional cost curves
- TiO2 pigment cost curve by technology
- TiO2 pigment profitability curve by technology
- Cost and profitability: Chloride plants – year in review
- Cost and profitability: Sulfate plants – year in review
- Chloride versus sulfate producers – year in review
- Chloride versus sulfate technology: Five year review
tilmenite
GLOBAL PRODUCER PROFILES
- TiO2 pigment portfolio analysis: Global producers
- Chemours: Five year review
- Chemours: Position on curves: year in review
- Kronos: Five year review
- Kronos: Position on curves: year in review
- LB Group: Five year review
- LB Group: Position on curves: year in review
- Tronox: Five year review
- Tronox: Position on curves: year in review
- Venator: Five year review
- Venator: Position on curves: year in review
rutile
COST DEVELOPMENTS
- Cost developments all sites: Five year review
- Titanium feedstock consumption by producer: year in review
- Coke consumption by producer: year in review
- Chlorine consumption by producer: year in review
- Sulfuric acid consumption by producer: year in review
- Fixed costs: Five year review
tilmenite
FACTORS AFFECTING RESULTS
- Titanium feedstock
- Titanium feedstock: Transport
- Chlor-alkali chemicals
- Sulfuric acid
- Calcined petroleum coke
- Energy
- Waste treatment solutions
- Co-products
- Foreign exchange rates
- Other factors
rutile
DEFINITIONS
- Titanium feedstocks
- Technical definitions
- Financial definitions
feedstocks
APPENDICES:
- Producer manufacturing statements
TZMI Unveils 2025 Global TiO₂ Pigment Producers Comparative Cost & Profitability Study: Two Decades of Transformation
Perth, Australia – September 2025 – The titanium dioxide (TiO₂) pigment industry has undergone a profound transformation over the past 20 years, and TZ Minerals International (TZMI) captures this evolution in its newly released Global TiO₂ Pigment Producers Comparative Cost & Profitability Study 2025. This comprehensive report benchmarks 2024 operating costs and profitability, offering a rare view into the economics of an opaque industry that touches everything from architectural coatings to plastics and paper.
The 2025 edition of the study covers 96 plants, representing more than 98% of global TiO₂ capacity in 2024:
- 71 sulfate technology plants
- 24 chloride technology plants
- 1 novel HCl technology plant
When TZMI first published this study in 2005, the global cost curve looked very different. In real 2024 US dollars, the weighted average manufacturing cash cost stood at US$2,545 per tonne in 2004 and US$2,600 per tonne in 2014. Fast forward to 2024, and that figure has fallen to US$2,116 per tonne, despite rising energy costs and environmental compliance pressures. The reason? Scale and efficiency. Chinese sulfate plants now dominate the low-cost segment, flattening the global cost curve and reshaping competitive dynamics.
Demand rebounded strongly in 2024, climbing 9% year-on-year to 7.44 million tonnes, led by India (+18.4%) and China (+9.7%). However, pricing softened late in the year, with the global average price settling at US$2,598 per tonne. Anti-dumping duties in Europe, Brazil, India, and Saudi Arabia are set to reshape trade flows, while freight disruptions and energy volatility added complexity to cost structures in 2024.
Global production reached 7.7 million tonnes in 2024, up from just 4.7 million tonnes in 2004. The industry’s average revenue-to-cash cost (R/C) ratio improved to 1.08 in 2024, up from 1.06 in 2023, but still remains in dire economic territory. Weighted average pre-tax operating income (PTOI) rose to US$185 per tonne, but challenges persist with 23% of global production still operated below cash break-even last year.
“This study underscores two decades of structural change in TiO₂ economics,” said David McCoy, Executive Chairman of TZMI. “There are currently 1.5 million tonnes of production that are lower cost in constant dollar terms than the lowest cost plants in 2004 and 2014. All of this is Chinese material.”
“This study underscores two decades of structural change in TiO₂ economics,” said David McCoy, Executive Chairman of TZMI. “There are currently 1.5 million tonnes of production that are lower cost in constant dollar terms than the lowest cost plants in 2004 and 2014. All of this is Chinese material.”